United States House of Representatives elections, April 2018
Jump to navigation
Jump to search
| |||||||||||||||||||||||||||||||||||||||||||||||||||||||||||||||||||||||||||
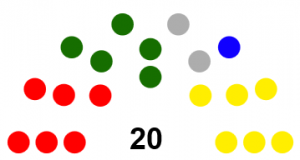
All 20 seats in the House of Representatives 11 seats needed for a majority | |||||||||||||||||||||||||||||||||||||||||||||||||||||||||||||||||||||||||||
| Turnout | 279 voters | ||||||||||||||||||||||||||||||||||||||||||||||||||||||||||||||||||||||||||
|
| |||||||||||||||||||||||||||||||||||||||||||||||||||||||||||||||||||||||||||
| |||||||||||||||||||||||||||||||||||||||||||||||||||||||||||||||||||||||||||
The April 2018 United States House of Representatives elections were held between April 9, 2018, and April 12, 2018, to elect 20 representatives from their respective states. The number of seats in the House of Representatives was increased by six. These elections coincided with the April Senate elections.
Results
Overview
| Party | Party Leader | Popular Vote | % | Seats | +/- |
|---|---|---|---|---|---|
| Radical Labor | Butterlands | 85 | 30.5% | 6 | |
| Libertarian | Elevic | 82 | 29.4% | 6 | |
| Green Democratic | Politophile | 64 | 22.9% | 5 | |
| Independent | 35 | 12.5% | 2 | ||
| Justice | Gestapo Brain & R U K U S | 13 | 4.7% | 1 | |
| Total | 279 | 100% | 20 |
